Industrial waste generated from solvents used in painting and coating processes contributes to EPA VOC emissions due to the chemical composition of commonly used solvents.
Effective solvent waste tracking is necessary for accurate industrial waste reporting and to ensure compliance with permit regulations. Recording and quantifying the chemicals that come from multiple sources or cleaning processes is a major challenge for facility managers in their industrial waste tracking practices.
As a facility manager, you will need an effective way of calculating how much of your solvent mixtures are contributing to your VOC emissions and how much are collected as waste.
This article will outline:
- Processes that produce solvent waste and VOC emissions
- Calculations for waste allocation and speciation for waste recording within your facility
- Ways to reduce air pollution from solvents and stay within permitted VOC limits
An eBook version of the content presented in this blog is also available for free download.
Uses of Solvents in Industry
Industrial solvent waste is generated from processes such as spraying and coating of automobile bodies, paint mixing operations, and cleaning processes such as purging or flushing.
Purging or flushing emissions are frequently over-reported during emission reporting. This happens if waste credits are not taken based on the amount of solvent waste collected at the end of the process. The mixture collected after flushing paint equipment is a mixture of both paint and purging solvent. It is difficult to quantify the ratio of paint-to-solvent in the waste mixture.
How Do I Calculate VOC Emissions from Purging Solvents in Waste?
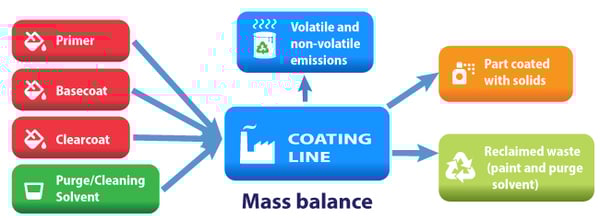
When calculating VOC emissions and credits, you must consider the materials and chemicals present before and after the coating process. The simplest model for calculating emissions is the mass balance approach. It assumes that everything that enters the system must be accounted for. If the used material is not collected as waste or stays with the finished product, then you must assume that it is emitted into the atmosphere.
To effectively apply the mass balance approach, you will need to know the composition of the paint or coating and how much of it you use in each time frame.
Before choosing a calculation method, you must consider the following questions:
- Is a chemical analysis available? If so, how often is the analytical taken?
- Is VOC content and/or percent solid known?
- What percentage of the waste collected is water or some sort of non-chemical (i.e. Rags, Personal Protective Equipment (PPE), etc.)?
- Is the waste generated from a single source or multiple sources?
- Should air emission credits be applied for this process?
The questions above can be overwhelming and difficult to consider during your calculations, which is why ERA has developed easy to follow processes that allow seamless recording of all contributing factors.
ERA’s Waste Module
ERA’s industrial waste management software provides simple and effective calculations that account for all waste tracking, including ‘complex’ sources and waste streams such as purge solvents and cleaning processes. The two methods of calculating the chemical composition and air emission credits for waste include calculating by quantity or by product.
Calculating by Quantity
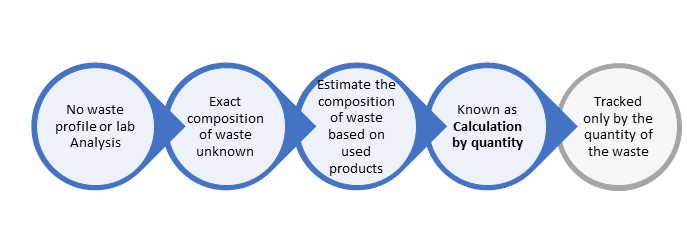
If you have no waste profile or analysis (or the analysis is taken infrequently) and your exact waste composition is unknown, we recommend calculating your credits and emissions based on the quantity and ratio of materials used which contribute to the waste stream. This model considers the chemical makeup of all materials used and quantifies the composition of the waste as a ratio or weighted average of the contributing materials used in the given time frame.
For each waste stream, understanding which process(es) generate waste is the first requirement for calculation by quantity. If your processes are consistent throughout the year, using the same materials and quantities, then you can use a fixed distribution estimate to quantify the ratio of each process and the contribution to the waste stream. When you have flexible processes with varying material usage quantities, then you can use the floating distribution model to automatically calculate the amount each process contributes to the waste total based on the quantity of materials used in a specific time frame.
Because processes and waste generation can vary, there are several methods that can be utilized to determine the total contribution from each process to the waste generated. In the sections below, we will review methods that are available in the ERA software and the context in which they may be useful.
Distribution by Usage Only
When distributing waste based on usage only, the calculation is based solely on the amount of usage from each source in each period.
For example, if you have a solvent source that uses 160 gallons of material per month and a paint source that uses 40 gallons, you would have a distribution ratio of 80% to 20% for the two sources, respectively. This ratio can be used to estimate the amount of waste produced by each source or process by applying these percentages to the amount of waste collected. So if your facility produced 100 gallons of waste, the calculation assumes that 80 of those gallons are made up of solvent material and 20 of paint material, according to the determined distribution.
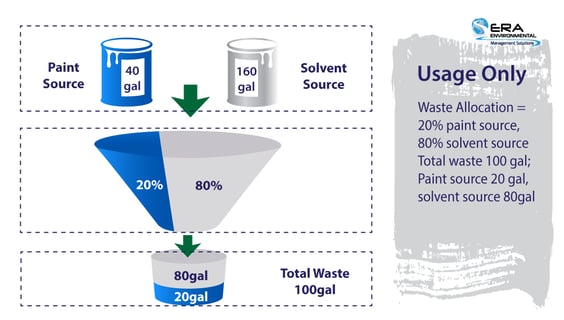
Once the amount of waste allocated to each source is known, the system calculates the composition of the waste and the air emission credits based on a ratio (weighted average) of the composition of all materials used.
This method is primarily useful if you have several processes with similar materials used (e.g. multiple paint sources) and each contributed to the generated waste at an equal rate.

Calculating by Usage and Other Parameters
If you have several processes which have different materials used and do not contribute to the generated waste at an equal rate (i.e., purge solvent), then other methods can be used to determine how much of each source would contribute to the waste stream. In purging processes, for example, typically a high VOC solvent is used to clean spray equipment, and the resulting waste stream is a mixture of solvent and some paint that is collected in the cleaning process. This can make it challenging to quantify the total amount of waste collected and properly calculate air emission credits for each source and with the correct VOC and chemical composition.
Let's explore a couple of different methodologies for such calculations.
Usage and Max Recovery
For processes such as purge solvents, if a recovery rate for the solvent is known or tested, then a maximum recovery rate can be applied to the distribution calculation. This can be particularly useful if the amount of waste collected is greater than the amount of solvent used in the period being evaluated.
You can define a maximum percentage distribution that can be allocated to a given source or sources based on your process knowledge or test records.
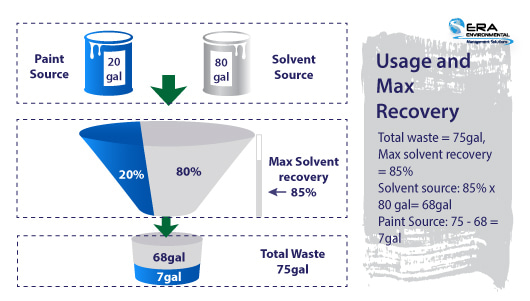
For example, if your solvent source is the main contributor and it has a maximum recovery rate of 85%, then up to 85% of the total waste collected will be allocated to the solvent source. Any remaining waste will be allocated to other sources contributing to the process (such as paint).
Now let's assume that, in one month, you used 80 gallons of solvent and 20 gallons of paint, and recovered 75 gallons of waste from this process. The ERA system will calculate the amount of waste that can be allocated to the solvent source based on the maximum recovery rate. In this case, that is 85% x 80 gallons (the usage) = 68 gallons. The remaining amount of waste (7 gallons) will be attributed to the other source(s), in this case, the paint source.
If the amount of waste were less than the maximum from the predicted solvent, then all of the waste would be allocated to the solvent source.
Usage and % Solid Waste
For processes such as purge solvents, if you have test data to quantify the % solids in the waste and the recovery rate is unknown, then the % solids can be used to logically calculate the amount of paint vs. solvent in the waste. Purge processes use solvent that contains only volatile chemicals; therefore, non-volatiles (solids) must be coming from paint materials that are collected as part of the purging process, as represented in the diagram below.
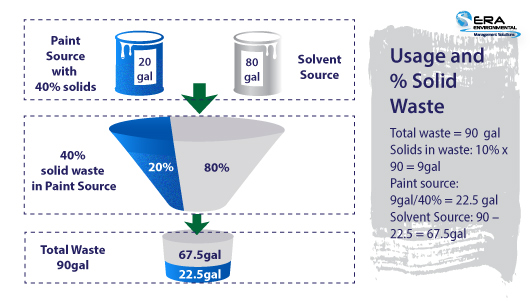
When using a value for % solids in the waste collected, the system first considers the amount of paint waste that would contribute to the waste stream based on the % solids in the waste and the % solids of each paint material used in the time frame.
For example, assume that you collected purge solvent waste which contains 10% solids and that you used 20 gallons of paint with a weighted average of 40% solids in the paint materials. To determine the quantity of paint in the waste, the system will calculate the number of solids in the waste (total waste collected x % solids in waste) and then divide that amount by the weighted average % of solids in the paint used.
In the image above, you can see that in this example, the calculated amount of paint in the waste is equal to 22.5 gallons. The remainder of the waste collected (90 - 22.5 = 67.5 gallons) is assumed to be solvent material.
Calculating by Product
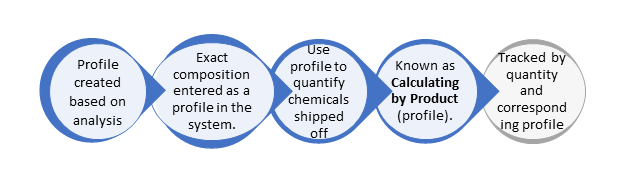
If you have your waste profiled by a company or have an SDS for expired materials, you can use the test record to analyze the composition of the waste. This method is useful when the exact composition of the waste is known and tested regularly.
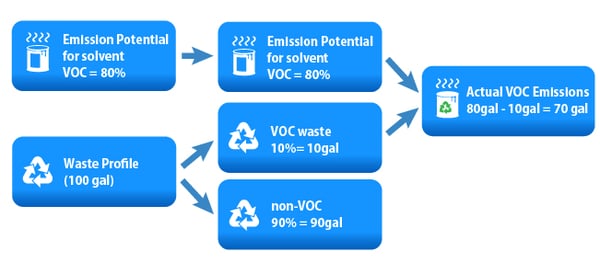
You can use the known VOC content and composition of the waste profile to calculate the emissions and credits of each source. For example, in the image below, the emission potential and the information from the waste profile are both used to calculate the emissions.
Tips for Managing Solvent Waste
After the collection and tracking of waste, it is important to ensure that you have a good pollution prevention and industrial waste management strategy. Here are a few tips on how to dispose of or manage your solvent waste.
- The most beneficial way of managing solvent waste is by recycling it. Waste solvents are often purified by distillation and can be reused in the facility
- Reuse your cleaning solution or solvent by using dirty solvent for initial cleaning, followed by clean solvent
- Use cleaners with low toxic content, such as water-based cleaners
- Change products to waterborne coatings or other coatings with high solids content
- Incorporate sustainability practices in your facility's procedures
Additional tip for TRI reporting: If the solvent waste is recycled on-site, then you do not need to consider the volume of recycled solvent used for threshold determinations. However, it is critical to track the total quantity used to ensure accurate emission calculations, both for TRI and for permit compliance.
How Can ERA’s Waste Module Help You?
ERA's Hazardous Waste Module can effectively complete all the aforementioned calculations for you, track progress toward your waste-related goals, and output a report that shows the distribution of waste per month, including waste managed via recycling, incineration, and reuse. Our team of experts help with the initial mapping and determination of the best method to quantify the composition and air emission credits for waste collected. This model can be used consistently on a monthly or annual basis for accurate reporting.
This Blog was Co-Authored By:


Comments